In the world of technical analysis, linear regression is a powerful tool for identifying the direction and strength of a trend. The Linear Regression Line + Signal indicator for MetaTrader 4 (MT4) takes this concept a step further by not only plotting the regression line but also generating signals based on the slope of the line—helping traders make smarter, more timely decisions.
🔍 What Is a Linear Regression Line?
A linear regression line is a statistical tool that models the relationship between time and price. It draws a straight line through the price data in a way that minimizes the distance between the line and the actual prices. This line represents the trend of the market over a given period.
Unlike moving averages, which smooth out price data, the regression line gives a more mathematically precise view of the trend.
⚙️ How the Indicator Works?
The Linear Regression Line + Signal indicator consists of two main components:
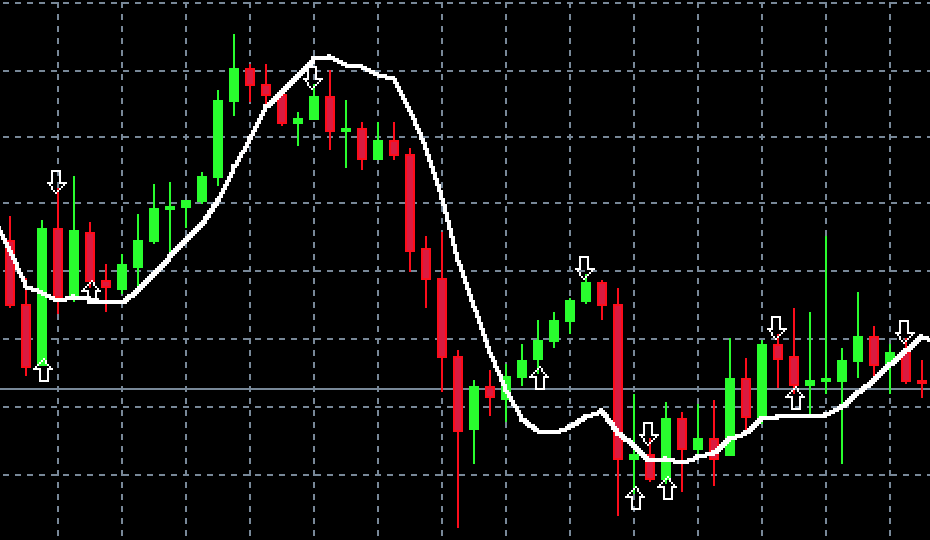
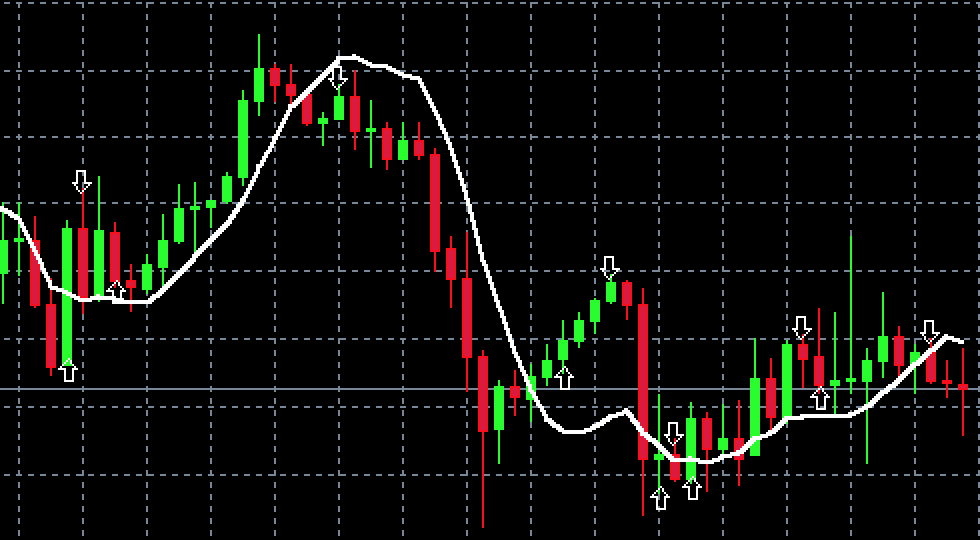
- Linear Regression Line: Plotted on the chart to show the current trend direction.
- Signal Generator: Based on the slope of the regression line.
📐 Slope-Based Signal Logic
The indicator calculates the current slope of the regression line and compares it to a predefined slope threshold. A signal is generated when:
- ✅ Buy Signal: The slope crosses above the threshold, indicating increasing bullish momentum.
- ❌ Sell Signal: The slope crosses below the threshold, signaling bearish momentum.
// Logika sinyal: Crossing slope
   for(int i = MathMax(start, 2); i < rates_total - 1; i++)
     {
      double slope_current = LRLBuffer[i] - LRLBuffer[i - 1];
      double slope_prev = LRLBuffer[i - 1] - LRLBuffer[i - 2];

      // Abaikan crossing yang terlalu kecil
      if(MathAbs(slope_current) < slopeThresholdUsed)
         continue;
      // Crossing negatif -> positif => Buy
      if(slope_current > 0.0 && slope_prev <= 0.0)
        {
         if(lastSignal != 1)
           {
            BuyArrowBuffer[i] = Low[i] - ArrowOffset * Point;
            lastSignal_price = BuyArrowBuffer[i];
            lastSignal = 1;
           }
        }

      // Crossing positif -> negatif => Sell
      else if(slope_current < 0.0 && slope_prev >= 0.0)
        {
         if(lastSignal != -1)
           {
            SellArrowBuffer[i] = High[i] + ArrowOffset * Point;
            lastSignal_price = SellArrowBuffer[i];
            lastSignal = -1;
           }
        }
     }
This method helps filter out noise and only triggers signals when the trend strength is significant enough to warrant attention.
📊 Why Use This Indicator?
- Trend Confirmation: It helps confirm whether a trend is strong or weakening.
- Early Signals: Slope-based logic can provide early entry or exit points.
- Customizable: Traders can adjust the slope threshold to match their risk tolerance and trading style.
- Visual Clarity: The regression line offers a clean, easy-to-read representation of market direction.
🛠 How to Use It in Your Strategy?
- Trend Following: Use buy signals to enter long trades during uptrends and sell signals during downtrends.
- Filter Entries: Combine with other indicators (e.g., Bollinger Bands, RSI, or MACD) to confirm signals.
- Exit Strategy: Use slope reversals as exit points to lock in profits.
Colmar, 13 July 2025. Summer Time
Well said.